How lethal are the Tories? Part 1

You sometimes see the claim that the Conservative-led coalition killed thousands of disabled people by spuriously cutting them off from disability benefit. 3
This is naive to the point of deceit, as I’ll show. But it’s based on something which sounds similar: the fact that between 2011 and 2014, 2,380 people died after being declared “fit for work” (FFW), i.e. after having their main income stopped. (If we were to establish causation, and so responsibility, this would make the Tories about as lethal as uterine cancer, at 720 UK deaths a year.)
It’s not hard to find cases where causation seems likely. But, by inferring causation from the above raw figure, the “2,380” claim implies that the Conservatives are responsible for all mortality during their reign - which, even speaking as a Scotsman, seems a bit strong.
Media discussion of this fact was sloppy even by the low standards of public policy discussion. 11 There is no justice without accuracy.
Terms:
- ESA : Employment and Support Allowance; the UK’s newish main disability benefit.
- WCA : Work Capacity Assessment. Quasi-medical screening process for ESA.
Introduced by Labour in 2008, made much stricter by the Conservatives in 2011.
The following is just an observational argument: it doesn’t exonerate or condemn. All I can say for it is that it’s less pig-ignorant than parroting the uncontrolled figure. If you take one thing from this, make it You cannot infer anything about impact from one number, at one point in time, without a reference class.
In particular, it doesn’t make sense without accounting for the number of deaths in this group before the WCA reform. (Maybe 2380 is an improvement.) And it doesn’t make sense to compare even those numbers without accounting for large known influences on mortality, e.g. seeing if ages and genders differ between the compared groups. What we actually need is not ‘deaths’ but ‘excess’ deaths.
It took me 10 seconds to find age-adjusted data, compared to the general population, before and after WCA:
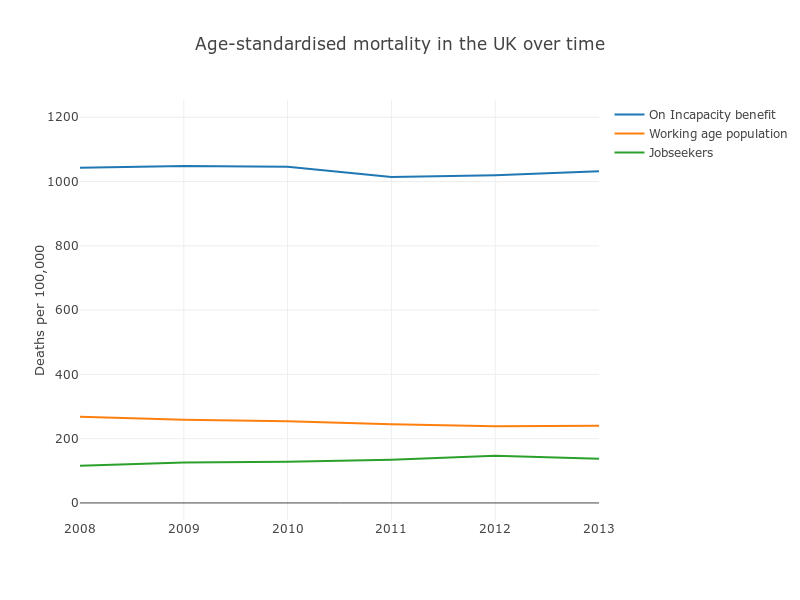 Suggested headline: "Go on the dole to save your life!" 2
No large changes: people on incapacity benefit have been dying very slightly less (1043 -> 1032), and there’s a slight increase (116 to 138) among JSA recipients. Given ~2.5m people on ESA, this fall works out to about 275 fewer deaths per year. 5 4
But we’re interested in the ones who aren’t on disability any more; in particular, the ones who were kicked off. (Many move onto Jobseeker’s Allowance (JSA), which is actually the lowest-mortality group, even after adjusting for the relative youth of people on JSA. Then there’s a group who presumably fall off the official stats entirely.)
So, compare the mortality rate of people on ESA (1.032%) with those kicked off it. The published data for WCA results only goes up to March 2013 at present; I’ll update this when they’re out, but for now let’s plot a dumb model for the 2013-4 rate:
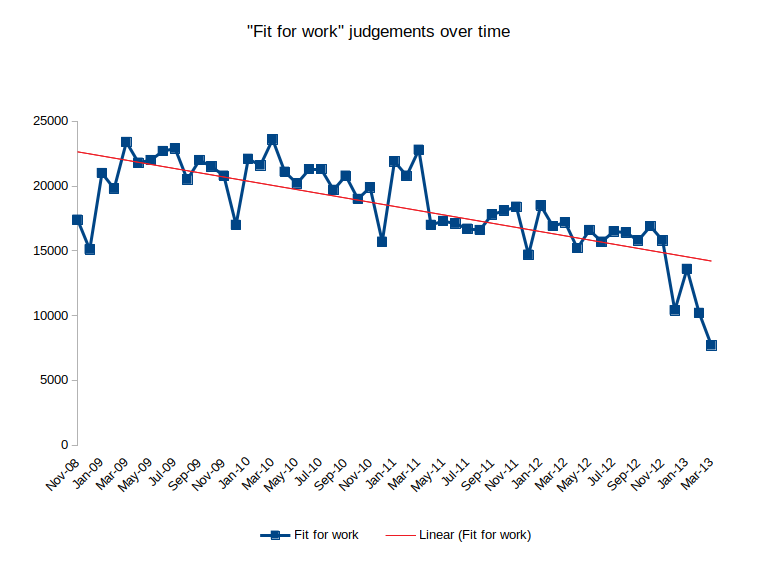
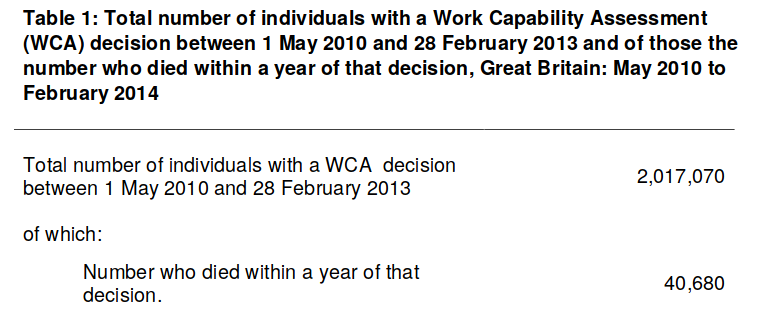
- December 2011 to March 2013: 238,100 declared fit for work.
- Extrapolation for April 2013 to February 2014: 131,500, if trend continued.
- Estimated total “fit for work”, December 2011 to February 2014: 369,600.
December 2011 to February 2014: 2,380 deaths among “fit for work” within 6 months of decision.
- Non-age-standardised death rate among “fit for work”: 0.64%.
- Age-standardised death rate among ESA recipients: 1.03%.
So the non-age-standardised death rate among those declared fit to work (0.64%) was halfway between the unfit-to-work (1.03%) and the general population rate (0.24%). 10
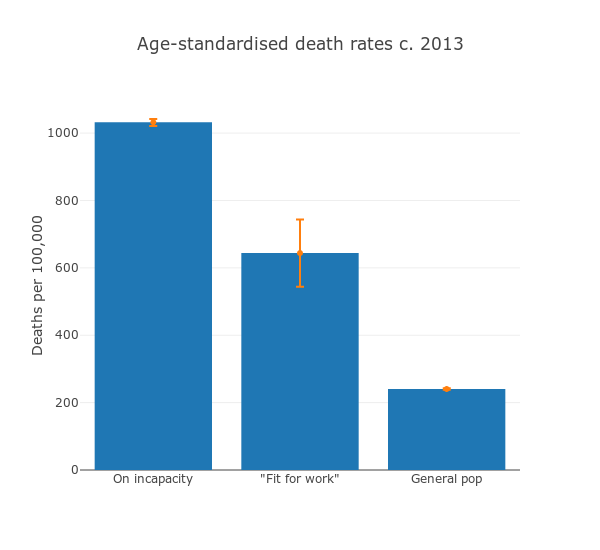
What does this tell us? That the “fit-for-work” population is not the same as the general population in some way. Without age standardisation, the following explanations are equally consistent:
People deemed “fit-for-work” were generally older than the general population.
The “fit-for-work” consist of more men than the general population does.
Half of “FFW” people were as unwell as the “unfit-for-work”; all “FFW” people were half as healthy as the general population; more likely, some mixture of these health statuses. This would be an indictment of WCA, since the general population is exactly what they’re treated as being.
Some combination of the above.
If the “FFW” had the same age and health distribution as the general population, you’d expect them to suffer roughly 887 deaths a year. 7 As it is, there were 1057, or something like ~170 excess deaths a year. 8
What we can get from this is an upper bound on responsibility. If we insist on extracting a figure to compare to the reported figure, then the WCA is associated with at most 383 deaths over this period, and probably less. 9 “2,380” is many times too high, even if it had been stated as an honest observation and not the resounding proof of blame it was stated as.
(Clearly this is too ambiguous for the purposes of political point-scoring. Things often are.)
The above has nothing to say about causation; many other things besides WCA could have and will have borne on these (e.g. age distribution, accidents, violence, decompensation). I don’t even have row-level data to properly establish that FFWs are a different population, let alone enough to isolate WCA’s effects on them. Actually all you’d need is the sample variances, but I can’t see them.
Labour vs Tories
Some people have told me that the above is incomplete without a comparison to the Labour period (2008-11); that it reads like a shrug. That’s wrong - it is reasonable and helpful to remove individual falsehoods from the pool - but neither is it unfair.
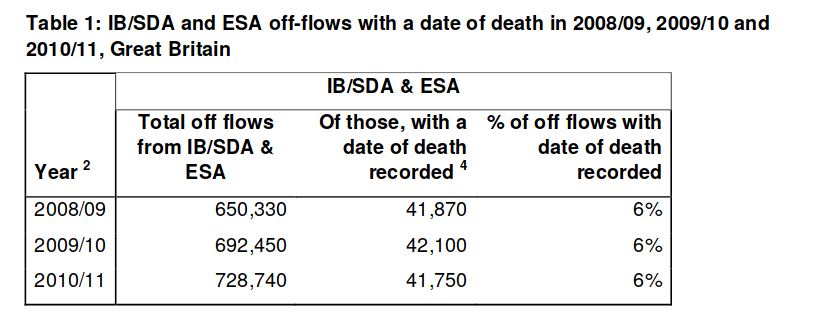
There were 537,800 “fit-for-work” judgments between October 2008 and January 2011.
We don’t have death data for them - the relevant Freedom of Information report for the period gives us the following shrug:
Data on the number of incapacity benefits claimants that have died following a fit for work decision is not available, as the Department does not hold information on a death if the person has already left benefit.
That’s not a lie, but we know it to be half-arsed given that they came up with this data for a different window, two years later.
Here’s something even more circumstantial than my above analysis:
Too much going on there; we just don’t know.
How bad are/were work competency assessments?
This section has several made up numbers.
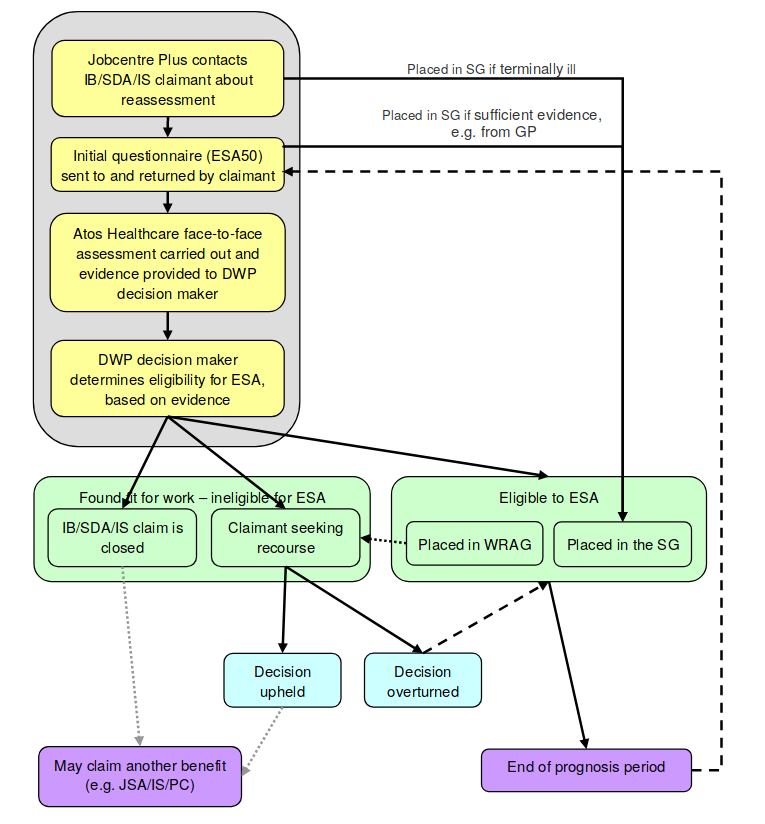
The main reasons to be suspicious of the 2011 WCA are: 1) they are sometimes not conducted by medical staff; 2) the private companies that run them are given narrow norms that probably result in a de facto quota; 3) they penalise less visible conditions like major depression and chronic pain.
If we had just a couple of numbers, we could use the awesome machinery of the confusion matrix to objectively rate how good WCAs are at their allotted dirty job.
Buckle up, because it’s time for some Bayesian inference.
If the WCA is a disability test, then call a fit-for-work judgment a ‘negative’ result: i.e. the WCA test doesn’t think you are disabled enough. Assume that a successful appeal is the same as showing a false negative on the original test (though in fact appeals will have some error rate too).
- Base rate for disability
P(H): One estimate is 21% of UK adults. - False positive
P(E | ~H): being flagged unfit-for-work despite not being disabled. Probably low: 10% ? - False negative
P(~E | H): being flagged fit-for-work despite being disabled: FNR = 59% - True positive
P(E | H): being flagged unfit-for-work and being disabled:1 - FNR = 41% - True negative
P(~E | ~H): being flagged fit-for-work and not being disabled: 1 - FPR = 0.9
We can use these to guess the conditional probability that someone is disabled given a positive WCA result (“unfit-for-work”):
P(H | E) =  P(E|H) x P(H)  / P(E|H) x P(H) + P(E|~H) x (1 - P(H))
	 = (0.41 x 0.21) / (0.41 x 0.21 + 0.1 x 0.79)
	 = 52.2%
Slightly better than a coin flip; and the conditional probability that someone is disabled in spite of a negative WCA result (“fit-for-work”):
P(H | ~E) =  P(~E| H) x P(H)  / P(~E|H) x P(H) + P(~E|~H) x P(~H)
	  = (0.59 x 0.21) / (0.59 x 0.21 + 0.9 x 0.79)
	  = 16%
i.e. Under these estimates, the test is fairly weak evidence. (Don’t rely on this; there are too many assumptions, and of necessity I’ve used the UK population rather than the test-taking population, which is bound to have a higher base rate.)
Data
People struggled with the Department for Work and Pensions to get these figures published. This is sometimes read as an admission of guilt. But given how naively the 2,380 figure was received, it is hard to blame them for their cowardice.
Although this official figure is very misleading

since it hides a recent rise in death rate (2010 - 2013) behind the big drop between 2003 - 2008.
We could reduce our uncertainty if we had data on the cause of death - e.g. hypothermia and suicide being evidence of WCA responsibility, while decompensation of chronic illnesses wouldn’t be. But we don’t.
I had a look for people who disappear from the system entirely, among the homeless. The government doesn’t collect this information (an oversight I’m inclined to be cynical about), and the charity Crisis haven’t updated their numbers since 2009, just outside our analytical window. They are not counted; they do not count.
This analysis doesn’t cover public time lost to bureaucracy, nor the poverty and distress of those who didn’t die.
Part 2 of this series will be about the stronger academic claim that austerity caused 30,000 - 45,000 excess deaths, mostly among the elderly.
Part 3 might be about the mental health impact of WCA, though maybe not - that report doesn’t make very questionable claims.
- Numbers from official spreadsheet here.
- ESA is probably the only government program in the world with a Palme d'Or winning film about how shit it is.
- Aside: there are 13.3m self-identified disabled people in Britain: 21% of us.
But only 3m are receiving the benefit they're presumably entitled to. Would be interesting to see the relative importance of 'family support vs pride vs literal inability to get through the bureaucracy':More than a million withdrew their claims before reaching a face-to-face assessment – this can be due to individuals recovering and either returning to work, or claiming a benefit more appropriate to their situation.
- 2008 death rate: 1,043 per 100,000.
2008 deaths: 1,043 x 25 hundred-thousands = 26,075
2013 death rate: 1,032 per 100,000.
2013 deaths: 1,032 x 25 hundred-thousands = 25,800
Difference: 275 deaths. - Code here.
- 0.24% annual death rate x 369,600 fit-for-work cases = 887 a year.
- 27 months in the sample, December 2011 - February 2014.
2,380 deaths / 27 months * 12 months = 1057.7. - 170 / 12 = 14.17 excess per month
14.17 * 27 = 382.5 excess deaths over the given period. - Important assumptions: that each of these represents a different person (i.e. that no one gets multiple FFW rulings).
- The Huffington Post reported this as 4000, adding up two figures which are obviously non-disjoint. Their sheer arithmetical incompetence is unusual, but no outlet (besides Full Fact) took any of the following absolutely critical factors into account. Journalists are doing social science when they report on these matters, and they are doing it unbelievably badly.