Graphs are cool
If you were to learn one area of maths properly, what should it be?
Depends what you want to do with it. Send tweet.
In computer science or machine learning, when people talk about the areas you need, they usually mention calculus, linear algebra, probability theory.1 These are some of humanity’s greatest achievements, and probability can totally change your life, since (outside of mathematics or the wider Set Exercises of school) we have nothing to work with but probable and improbable, priors and data.
What if you’re not a technical researcher? What if you just want to get as much clarity as you can, without devoting years of your life to it?
After probability and basic programming, I think there’s no area better than graph theory. It is both incredibly intuitive and hyper-efficient. It is useful for almost any discrete application: logic, science, society, … It lets us do lots of things whenever we have “some relations between some objects”, i.e. any time we can ditch the continuous.
Obviously this is isn’t as abstract as we can go - why have those clunky objects? But it’s a nice median.
Getting into the habit of drawing a directed graph is probably the simplest way of thinking better. It takes one minute, and even the qualitative unweighted version will allow you to instantly spot disagreements. I dream of a world where people disagreeing (on Twitter, in debates, in journal letters pages) head to Sketchviz and work out exactly where they’re diverging, probably in the relative thickness of two edges. They are astoundingly useful for data-driven science. But they are unbeatable for communication.
Intuitive
Proof by inspection. You can go far in graph theory with visual reasoning.
[TODO: Gif of “every 4-path is self-complementary”]
Modularity. You can do lots of things locally, ignoring the overall structure.
It is always nice to be able to reduce some problem to shortest-path or minimum spanning or message-passing or any of graphs’ optimal dongles.
So many things are graphs
In some sense anyway, whether it’s mathematical equivalence , having a 1-1 mapping (logic), partial capture of structure (groups), or just a useful approximation (society).
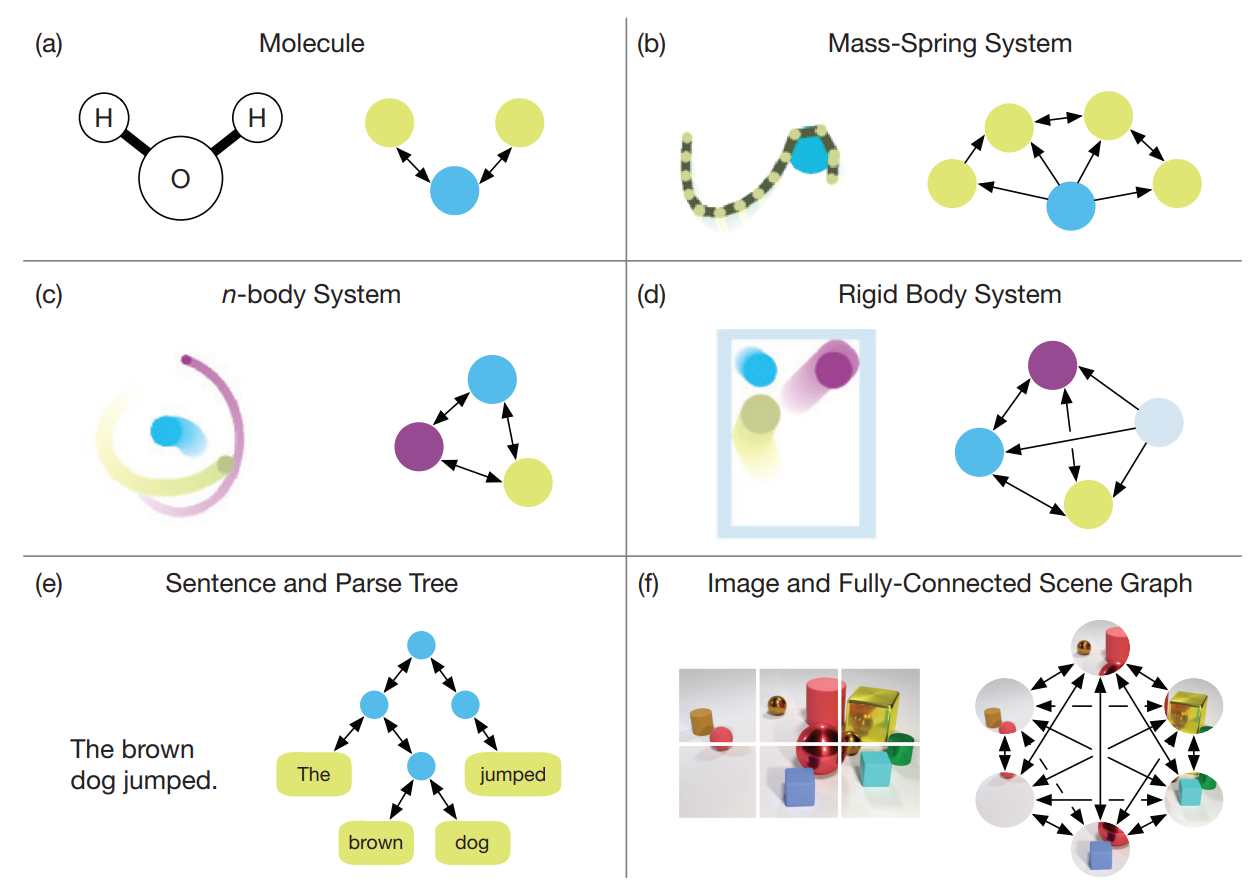 Battaglia et al (2018)
Sets are graphs
without edges.
Logic is Trees is Graphs
Any well-formed sentence of logic has a syntax tree, which is a graph.
(Also linked-lists are trees are graphs…)
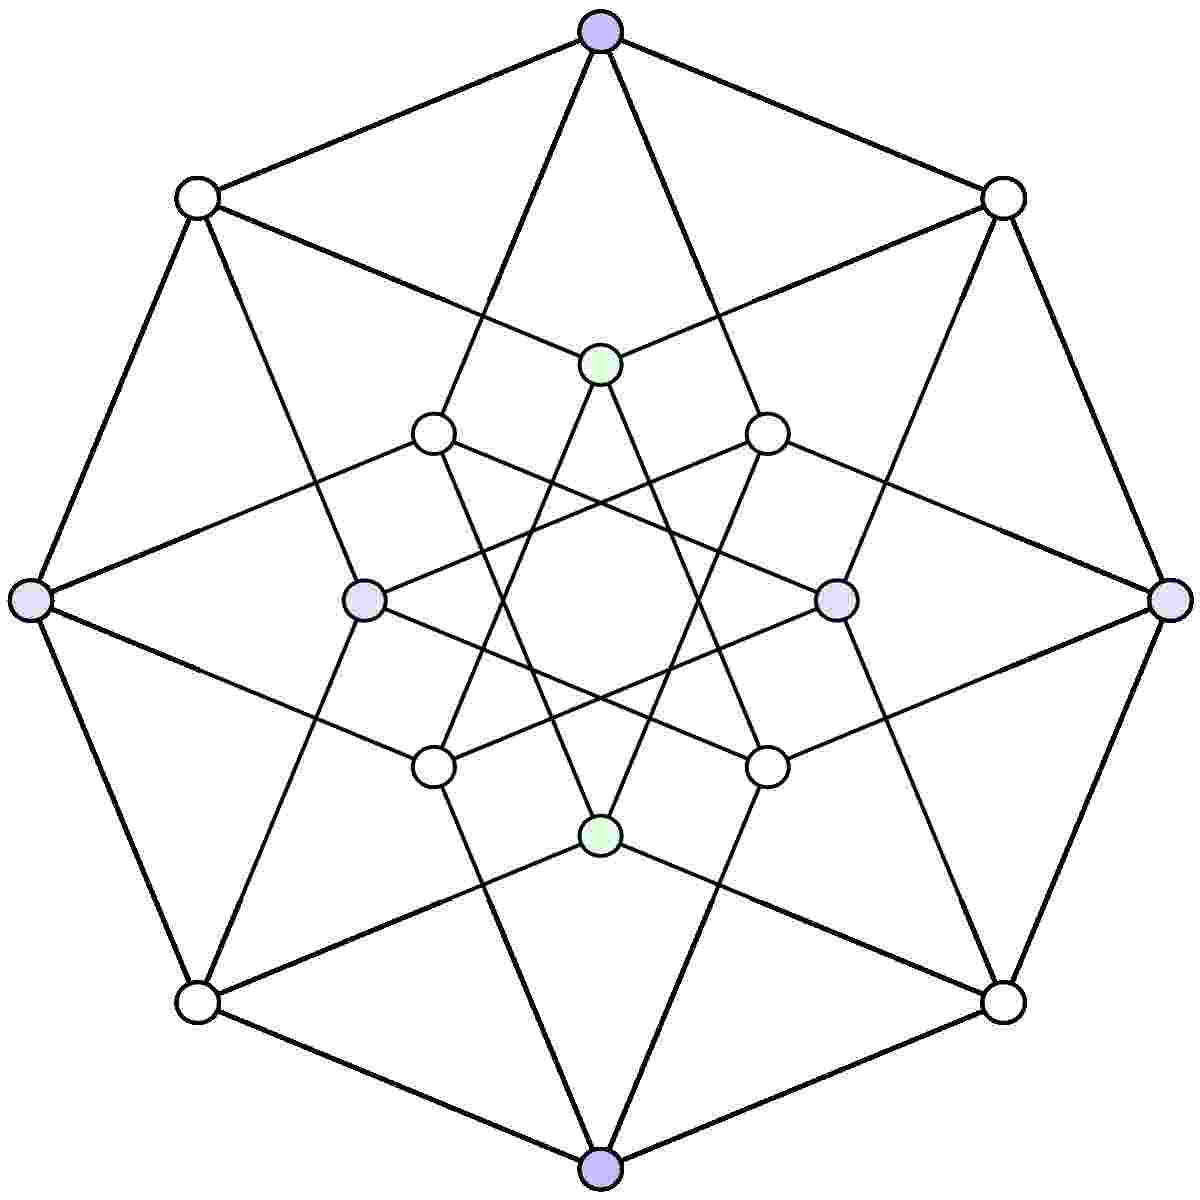
Groups have graphs
Optimisation is shortest-pathing
Ray tracing and Q-learning and currency arbitrage is graphs. I love this post so much.
See also constraint sat as graph.
Graphical models: joint distributions have graphs
Under very general conditions, joint distributions have graphs. 3
Statistics is one of the hardest things I ever learned. It’s just so vast, and even a good grasp of the theory (which almost no-one has) does not prevent 100 completely fatal silent mistakes. Graphs unify the stats zoo.
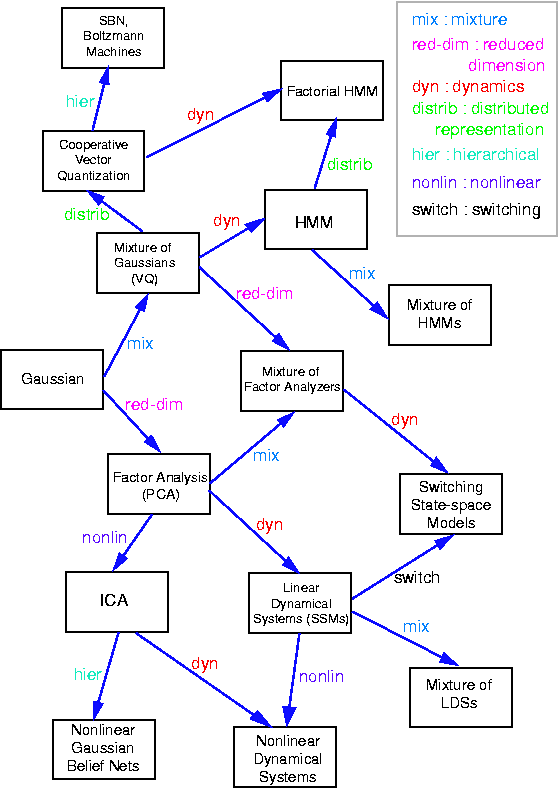
Many of the classical multivariate probabalistic systems studied in fields such as statistics, systems engineering, information theory, pattern recognition and statistical mechanics are special cases of the general graphical model formalism – examples include mixture models, factor analysis, hidden Markov models, Kalman filters and Ising models.
plus PCA, vector quantization, …
Strictly speaking there isn’t a lot of graph theory in PGM work. But some graphish algorithms like message passing are still cutting-edge. 4
Causal inference
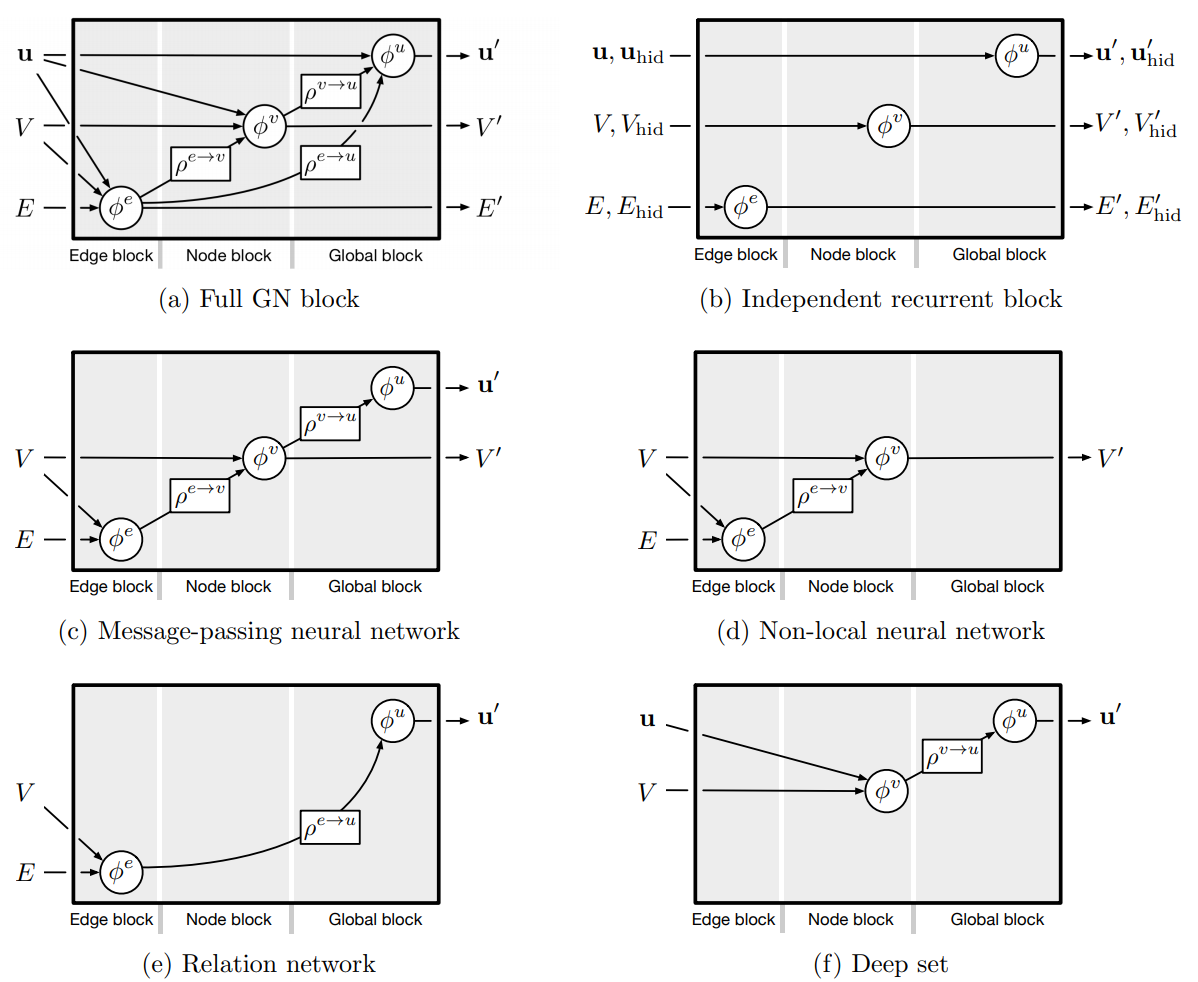
Graph neural networks
Convolutions are graphs. (Edge from a node to all neighbours and self.)
The Transformer is a graphnet.
This paper tries to unify many of the discrete neural nets that have sprung up into one framework, and it has an extreme grandeur.
Massively efficient algos
Many serious databases use trees. i.e. Every formal activity in modern society relies on graphs.
High theory
Just one instance of it showing up in remarkable mathematics: Ramsey theory for Szemerédi.
Szemerédi’s theorem: “any subset of integers of positive (upper) density must necessarily contain arbitrarily long arithmetic progressions.”
(This is number theory but the proof flits between that and graphs.)
You get there via Ramsey’s theorem: “any finitely coloured, sufficiently large complete graph will contain large monochromatic complete subgraphs.”
The path from basic principles (Pigeonhole or Handshake) to huge results like this seems shortest in graph theory. Or maybe that’s just my brain.
Life as graph
Learning the descent of species.
Learning which cells are connected(!)
Society as graph
PageRank treats the internet as one giant implicit graph.
A lot of the best sociology and epidemiology uses graphs as the core tool.
Thought as graph
I do not speak, I operate a machine called language. It squeaks and groans but is mine own.
When I write, I am taking the great implicit graph of my thoughts and ripping out a tiny number of particular nodes, and maybe two or three of the many edges. I then serialise these nodes (imposing an artificial order, discarding my weights, idiosyncratic associations, and colour), and have to just hope that you are able to reconstruct some of the original graph from the drips that come through the narrow and impoverished channel of language.
The “don’t call it a notetaking app” notetaking app Roam is designed with this in mind, and it is by far the least unpleasant way of thinking about everything I’ve ever seen.
I am dazzled by how general it is. I haven’t seen any list of the above; I just kept on finding it in new places, it just kept eating objects until I fell in love with it.
Of course you can go much more general in at least three directions: programs, for instance, are much bigger than graphs. But for an easy step into rigorous and general ideas they are the winner.
Drawing quickly and beautifully
Graphviz is kinda painful to use without a live GUI, but Sketchviz pretty much works unless you have very strict spacing in mind.
See also
- Yes, these are just circling the perimeter of statistics, but stats is not a branch of mathematics.
It used to be logic. Much of the really deep recent work I see uses representation theory and info theory, but this isn't where to start. - It's not that joint distributions "are" graphs; rather the conditional independence structure associated with the joint is a graph.
- Here are some cases where graphs are not very illuminating about models. The post is unfair, since the objects described are just very complicated, and even the model listing is not straightforward, and there's nothing stopping you from doing both representations.